Create a Visualization
- Create a Visualization in the program structure by right-clicking on the application.
- Click the “WagoSoIMTP” tab in the “Visualization Tools” panel.
- Standardized visualization elements are displayed.
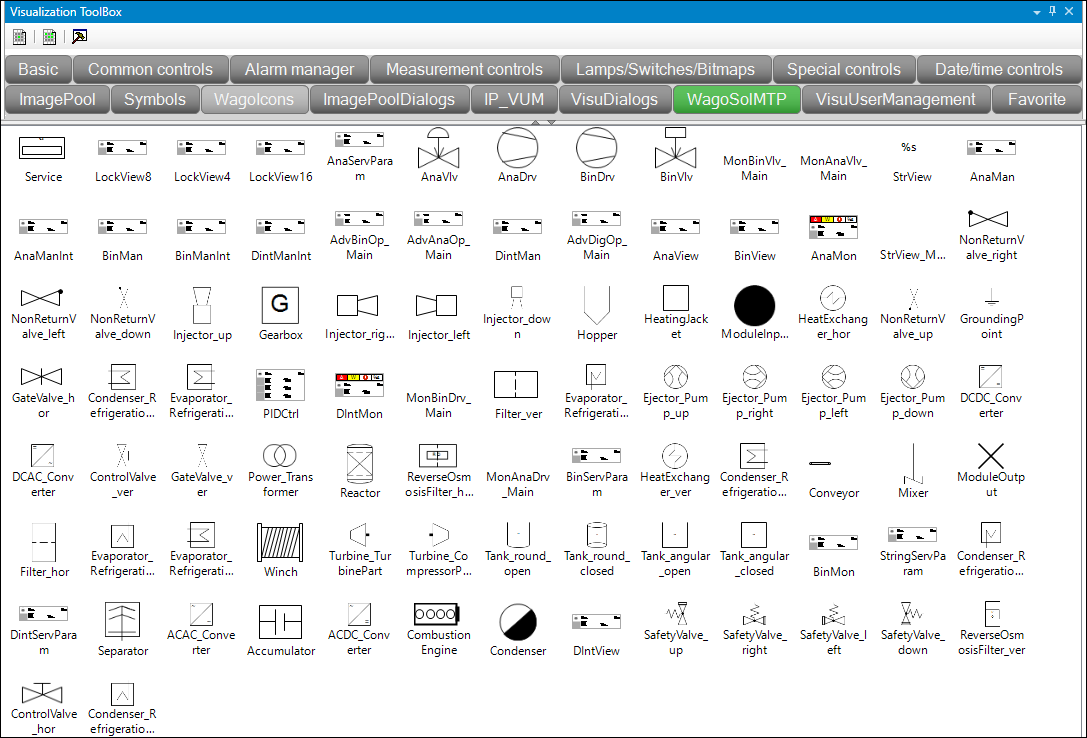
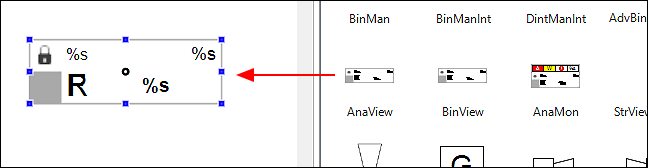
- Place the visualization elements of the same name in the workspace belonging to the function blocks.
- Tip:
Instead, you can also add the <Frame> element from the “Base” tab and then select your visualization element in list form via a structured selection dialog. - Open the panel “Properties”.
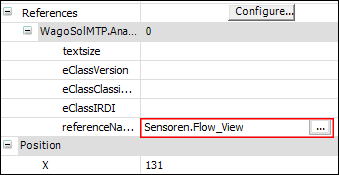
- Use the properties to create a connection between the visualization element and the function block. To do this, set the "referenceName".
- Tip:
Click [...] to use the input help and select the variable from your application that you want to link to the visualization element. 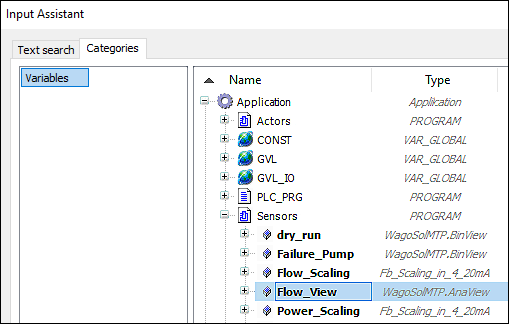
- This link provides a local manual control function via the module-level visualization.
- Place an additional, static visualization elements.
- Connect the visualization elements with each other, e.g., to create a piping diagram. To do this, use the different connection types from the “Properties” panel.
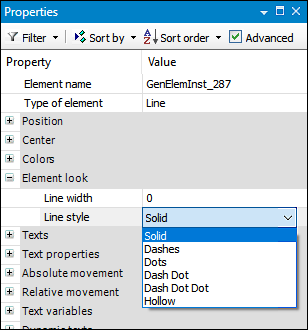
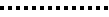
- “Pipe“
- represents relationships in the material flow (solid line).
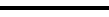
- “Function Line” Signal
- represents a logical connection, e.g., an electrical signal in the form of a control loop (dotted line).
- “Measurement Line” Signal
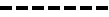
- signals the relationship between material and information flow, e.g., flow rate measurement (dashed line).
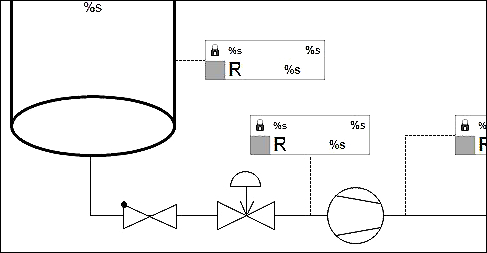
Tip:
Make sure that the connection line actually touches or cuts through the elements to be connected. If it ends before the element, the connection is not recognized as such.