Creating Visualizations
e!COCKPIT integrates the visualization functions of CODESYS. These enable the use of predefined visualization elements and commands for simulating, controlling and monitoring machine and plant systems.
A web server connection (CODESYS Web-Visu) also enables a visualization to be operated with a web browser or displayed on an external device/display (CODESYS HMI).
 Note
Note
Ensure compatibility with web browsers!
The view of the web visualization has been tested and optimized for the following web browsers:
• Firefox
• Chrome
• Internet Explorer
• Opera
• Android
• Safari iPad
Note
Use scrollbars despite activated “Multitouch”!
The “Multitouch” function (see Visualization Manager > “Activate multitouch handling” Function) is intended to control the visualization via gestures.
If the function is activated, the scroll bars for certain integrated elements of the visualization are not displayed in the web browser (e.g., for tables or tab controls).
If a visualization is used with the activated “Multitouch” function on terminals that do not support this feature, the scroll bars will be shown. Add “?CFG_TouchHandlingActive=False” to the URL of your Web visualization
Example:
https://192.168.1.17/webvisu/webvisu.htm?CFG_TouchHandlingActive=False
Note
Use trend visualization for online devices!
You can visualize the graphical history of variable values over a longer time. If using such trending, make sure to use them for online devices only.
Trend visualization is not supported in simulation mode.
Note
“ActiveX Element” visualization elements are not supported!
Various control and visualization elements can be integrated in the Web visualization. For example, “ActiveX Elements” can be used to connect WebControls via JavaScript. If using the “ActiveX Element” visualization elements, the elements are displayed, but the visualization and function on the Website are not supported.
Note
Note browser compatibility for integrated graphics!
If integrating graphics in your Web visualization, please note that the “wmf” file format (Windows Metafile) as a Microsoft-specific format is not supported by all browsers. Instead, integrate graphics in e.g., “jpg”, “png” or “svg” format.
- First, open the “Program Structure” panel.
- Add a visualization by right-clicking an application and selecting [Visualization] as a new element.
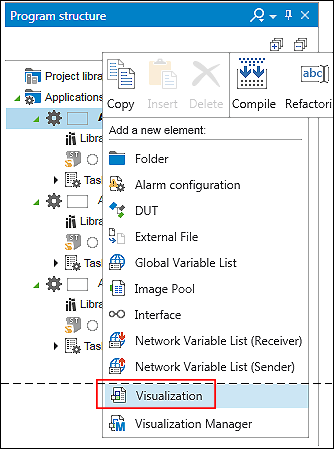
- A dialog opens where you select the icon libraries (images/graphics for visualizations) that you can use in your project.
- Select the required libraries and click [Add].
- The visualization editor is opened in the workspace.
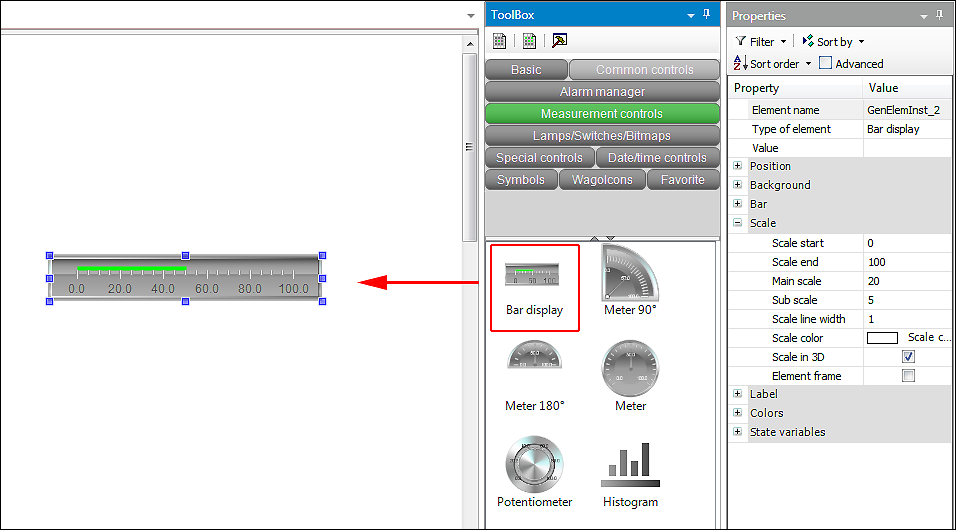
The “Visualization Tools” and “Element Properties” panels are displayed by default. You can show closed panels at any time via the ribbon, “VIEW” tab. - Use the elements from the “Visualization Tools” panel, such as the bar display, by placing them in the visualization editor via drag and drop.
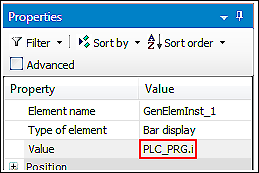
- To assign a value to the display, click the “Value” field and press [F2] to open the Input Assistant.
- Via the Input Assistant select a value which will be used for the visualization. This example uses the value “i” from the “PLC_PRG”. The value is accepted.
- In the “DEBUG” tab of the menu ribbon, click [Simulate application].
- To start the visualization, click [Start].
- This will start the visualization.
For additional information see:
- Panels > Program Structure