Starting the scan operation
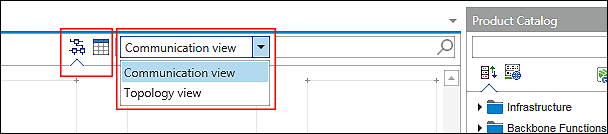
The scan results can be displayed in tabular or graphical format in both the Communication and Topology view. This depends on the view in which you start the scan. However, you can switch between views via the respective selection fields/tabs at any time, even during the scan.
 Note
Note
Tip for using the graphical or tabular view
The graphical view uses colored tiles to give you an initial overview of what differences there are between your project and the scan results. Among other things, the Communication view displays difference for the modules used and the Topology view also displays physical connection differences.
The tabular view is used to display other details of those differences in list form, e.g., a comparison of different I/O modules between project and scan in the Communication view or details on connections and device ports used in the Topology view. In the tabular view, differences are displayed in color similar to the graphical view.
In the following example, you first start the scan in the graphical view of the Communication view.
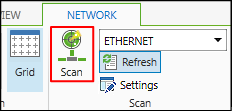
- To start the device scan in the network, click the [Scan] button in the “NETWORK” tab.
- The Scan view and “SCAN” tab of the menu ribbon open. Devices are searched.
- Scanned devices are displayed below any already configured devices.
The scan results highlight in color whether it is a new (blue), changed (orange), unknown (red) or unchanged (gray) device. 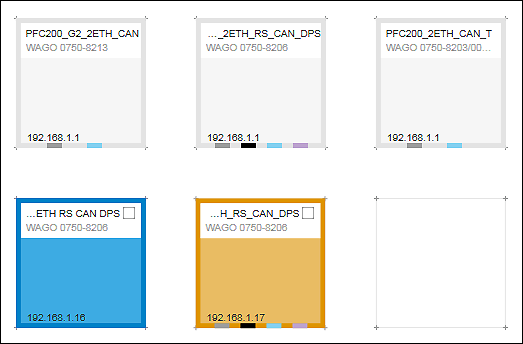
Your device is shown in gray:
The scanned device matches the configuration.
- Click the [Close scan results] button.
Your device is shown in blue:
The device is new and can be applied in the configuration.
- Select the checkbox of the device or devices you want to apply.
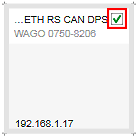
- The tile color changes from blue to gray.
- Click the [Accept selection] or [Accept all] button in the “Scan” tab of the menu ribbon.
Note: The dialog displays an incompatibility if the project-global compiler version or the visualization profile is not compatible with the device currently selected when you add it. Adjust the versions as needed (see Adjusting the Compiler/Visualization Profile).
Your device is shown in red:
The scanned device is new and unknown. There is no device description file; the device is not available in the product catalog. This can happen, for example, with custom devices.
- Contact Support to obtain a device description for your device.
- Note
Use compatible device description!
Please note that “dtp” file types are always permanently installed and cannot be imported.
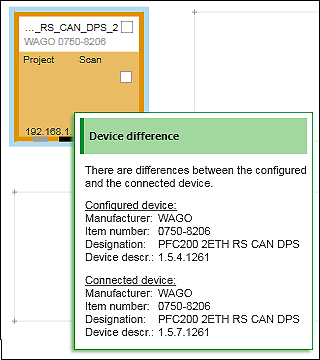
Your device is shown in orange:
There are differences in the configuration.
- Move the mouse over the device tile to display ToolTips with information on configuration differences.
- If you want to apply the scanned device despite configuration differences, select the checkbox for the respective device.
Notice: You overwrite the configured device by applying the scan results. - Click the [Accept selection] or [Accept all] button in the “SCAN” tab of the menu ribbon.
- The Scan view is closed. The configured devices are displayed.
- Note
Scan head stations and I/O modules separately or together!
You can also scan head stations directly, including the connected I/O modules, by clicking the small triangle next to the [Accept selection] and [Accept all] on [Selection incl. modules] or [All incl. modules]. In this example, you have first selected only the head stations to be applied. You detect I/O modules separately in the next steps.
Tip: If you are scanning a network with a large number of devices, there is no need to wait for all devices to be scanned if the device you want has already been discovered. In this case, click [Cancel] to end the scan early. All devices found to that point are then displayed in the scan preview.
Below you will scan the I/O modules connected to the device:
- Select one of the scanned devices and click [Scan modules] in the “DEVICE” tab.
Alternatively, select [Scan] in the device context menu. - If the device is not connected, a connection is established automatically. The I/O modules are then detected.
If you have run the module scan for multiple devices, differences are initially displayed within the tiles. 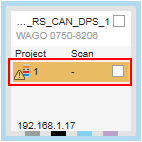
- In this case, switch to the tabular view for a more detailed overview.
If you have run the module scan for one device, e!COCKPIT automatically switches to the tabular view. 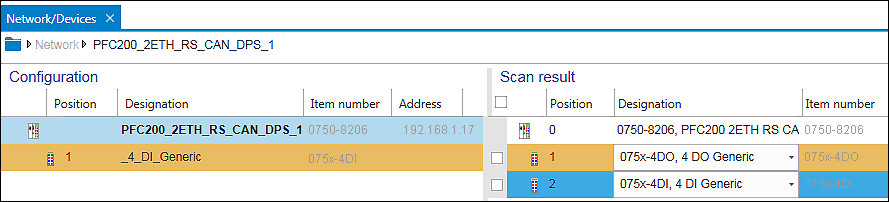
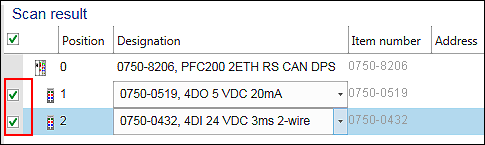
- The tabular view shows configuration and scan results. All modules that are connected to the device are displayed on the right and their device description files are loaded in e!COCKPIT. There can be selection fields for certain I/O modules. This happens because a device description file can represent multiple I/O modules if the I/O modules have the same process data structure. A detected I/O module may also be represented by multiple device description files.
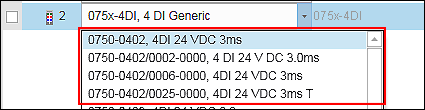
- Select the I/O modules from the selection fields that you use in the node.
If you make no selection, the pre-selected, generic I/O modules are used. - If there are multiple I/O modules with the same scan results in a node, the “Use for all suitable modules” checkbox is displayed in the selection field.
Select the checkbox to apply the selection for all suitable I/O modules at the same time. - Select the checkbox before the scanned I/O modules that you want to apply to the configuration.
- The colored marking of the rows goes away.
- Click [Accept selection].
Click [Accept all] to apply all I/O modules. - The Scan view is closed. The overview of configured devices is displayed.
You see the number of I/O modules applied at the bottom of the device tile. 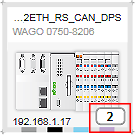
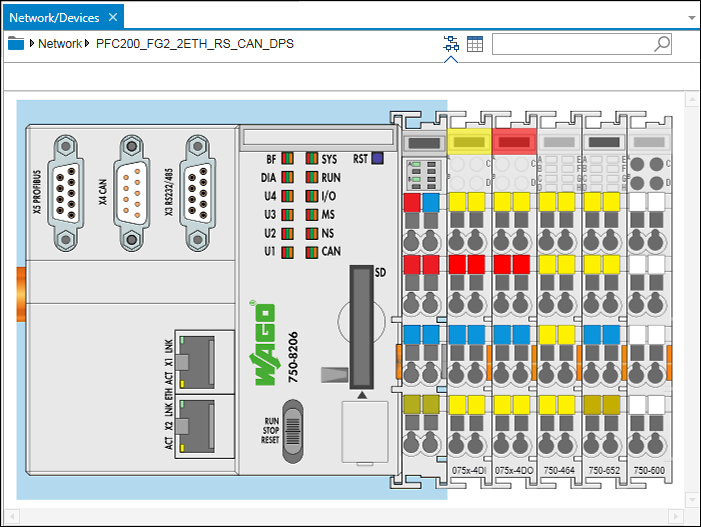
- The Device Detail view shows the head station with the scanned I/O modules.
Note
Note on the use of complex I/O modules
Note that I/O modules are always inserted with their default operating mode both when adding them from the product catalog and when scanning them on the network. If you use complex I/O modules with adjustable process data/mailbox size or different operating modes that do not correspond to the default setting, then configure process data/mailbox size/operating modes via the "Settings" control panel. You thus ensure that the existing configuration of the I/O module is also used in e!COCKPIT. Only then make further communication settings in the data point configurator and fieldbus configurator.