Debugging an Application
The debug function examines programming errors. This requires a connection to the device.
- Move to the “DEBUG” tab in the menu ribbon.
- To start the debug process, click [Start].
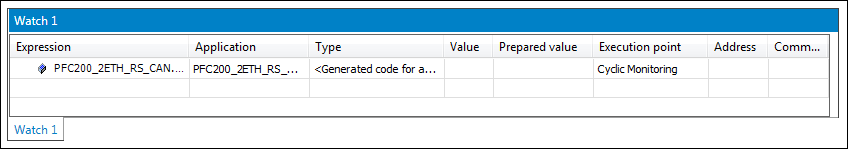
- To create a watch window, click the [Monitoring] button in the menu ribbon and select one of the five entries.
- This will open the “Watch” panel.
- Double-click the “Expression” field and then the […] button displayed there for the Input Assistant.
- Select the value or values to be monitored.
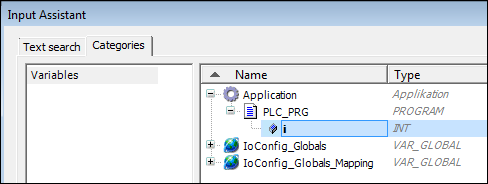
- Transfer the value or values by clicking [OK].
- Click the [New] button in the “Breakpoints” group to add breakpoints.
Breakpoints can be set at specific positions in the program to stop execution. Specific conditions can be defined for the stop (see CODESYS online help, “Breakpoints”). - Then click [Toggle] to activate the breakpoint.
Step-by-step processing via Single Step (menu ribbon, “DEBUG” tab) enables the program to be run in controlled steps. The particular variable values can be examined at each stop. A [Call stack] (menu ribbon, “VIEW” tab) can be displayed to determine the current position.
The flow control can be activated to track previous sections of the application program. Unlike standard monitoring, which only displays the value of a variable between two cycles, the flow control supplies the value for each processing step precisely at the time of processing.
For additional information see:
- Menu Ribbon > “VIEW” Tab
- Menu Ribbon > “DEBUG” Tab
- “Programming” Workspace > Breakpoints
- “Programming” Workspace > Call Stack